Ready to Leave Pro? (Webinar)

INTRODUCTION

The news is out: IMPLAN Pro is being laid to rest. After launching in 1999 as the second version of IMPLAN, it has had a great run. Join the IMPLAN Education Services team for a “Ready to Leave Pro?” presentation, where we will address all of your questions and concerns about leaving pro, and then walk through all of the newest features and exciting improvements to our software that will have you ready to jump into IMPLAN Version 6! Our two stand-alone sessions will both be taking place in early 2022, the first on Friday January the 21st at 1 PM EST, and the second on Friday March the 18th at 1 PM EST. Register for either of them from the links below!  

Ready to Leave Pro?

INTRODUCTION

So you heard the news: IMPLAN Pro is being laid to rest. It had a good run, being launched in 1999 as the second version of IMPLAN. Here we will outline all the good reasons why you will be so excited about jumping into IMPLAN Version 6! So here they are, all the Pros and cons. Get it?

NEW FEATURES

New Industry Impact Analysis Event and no more ABP 

The newest version of IMPLAN contains a new Event Type: Industry Impact Analysis (Detailed). You can now enter Values for Employment (Wage & Salary and Proprietor), Employee Compensation, Proprietor Income, Labor Income, Intermediate Inputs, Taxes on Production & Imports, Other Property Income, and Output. Yes – you can now enter any or all of these Values in IMPLAN so Analysis by Parts is no longer required when you want to do something like zero out TOPI.


Event Tags

Event Tags are a feature in IMPLAN that allow you to organize events within your projects by creating self-defined (and color-coded) categories. This process can save you time and help declutter the screen for easy viewing. Now it is remarkably easy to organize your Events and assign them to Groups and to view your Results by the new Event Tags!


State and Local Taxes are now Split 

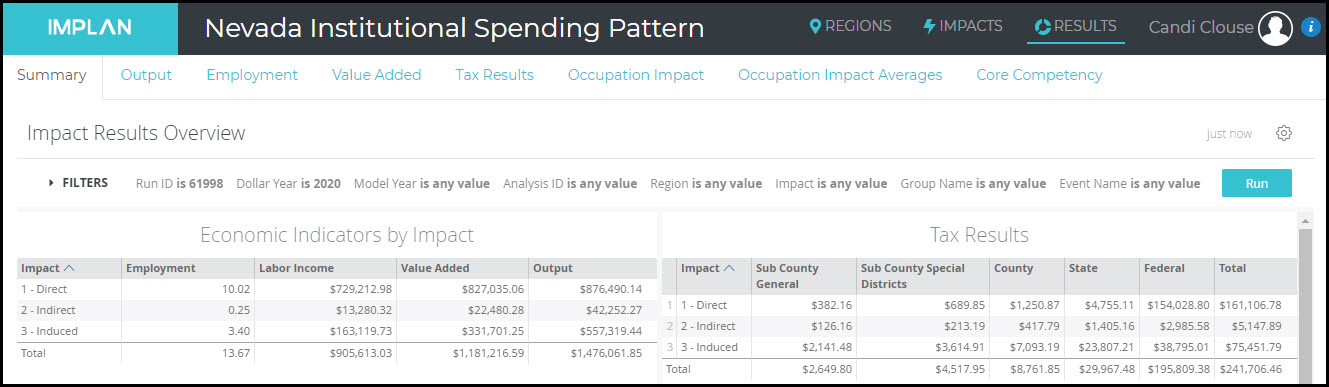
One of my favorite things in IMPLAN is the ability to examine taxes at a more granular level than “State + Local.” Now taxes are reported at five different levels! 

Tax Level

Explanation

Sub County General

City & Township

Sub County Special District

School, Fire, Police, etc.

County

County & Parish

State

Fifty Nifty States

Federal

Internal Revenue Service (IRS)

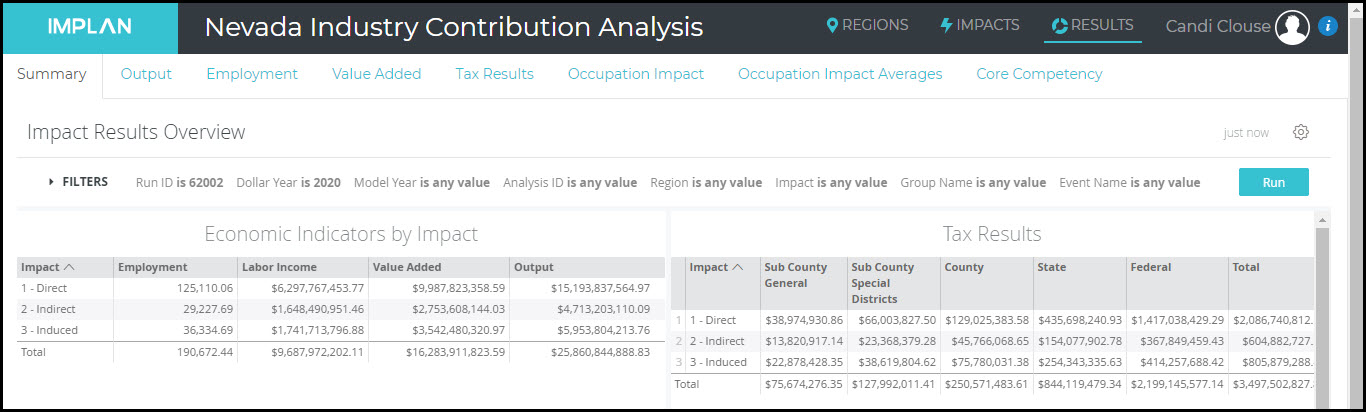
A new summary table on the Results screen gives a great overview.

Leave_Pro_-_Tax_Table.jpg

You can also dig into the details to see what types of taxes are included in each subset like sales tax, property tax, etc. (Details can be found in the article Where’s the Tax?). The Tax Results tab lets you look at each of the taxes by Direct, Indirect, and Induced Effects by using the Impact Filter. You can also download anything using the Dashboard Actions (vertical ellipses). 


Multi-Tab Functionality

IMPLAN now allows you to spread your work out across multiple tabs inside your internet browser while you’re working. Within the confines of even a single Project, you can open three different tabs in your internet browser and separate the Regions, Impacts, and Results screens across them in order to look at all your study’s components at the same time. You can also have the Results open for the same project open on multiple tabs with different filters on each. 


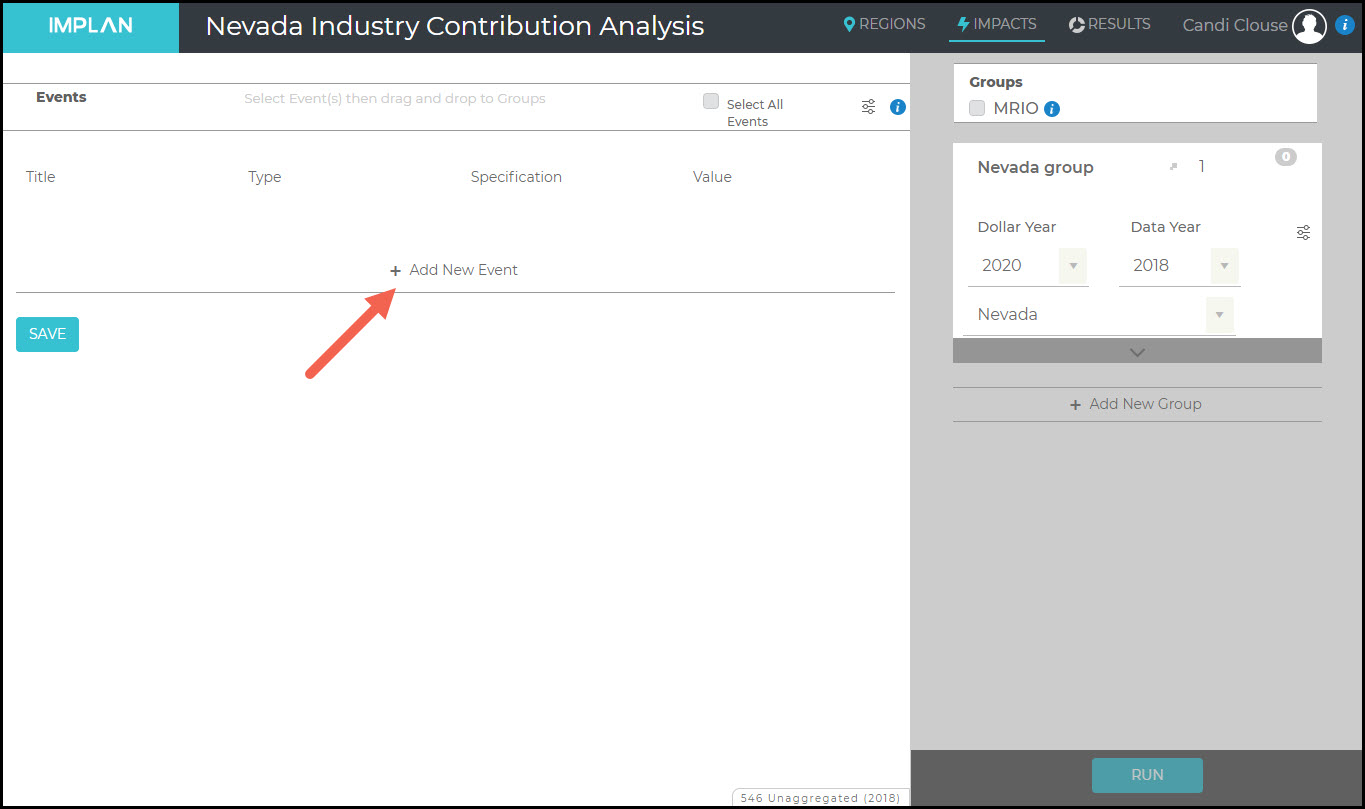
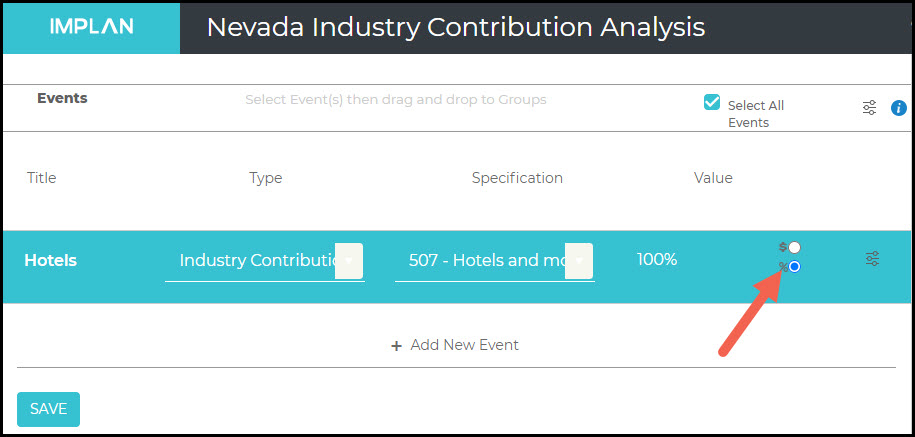
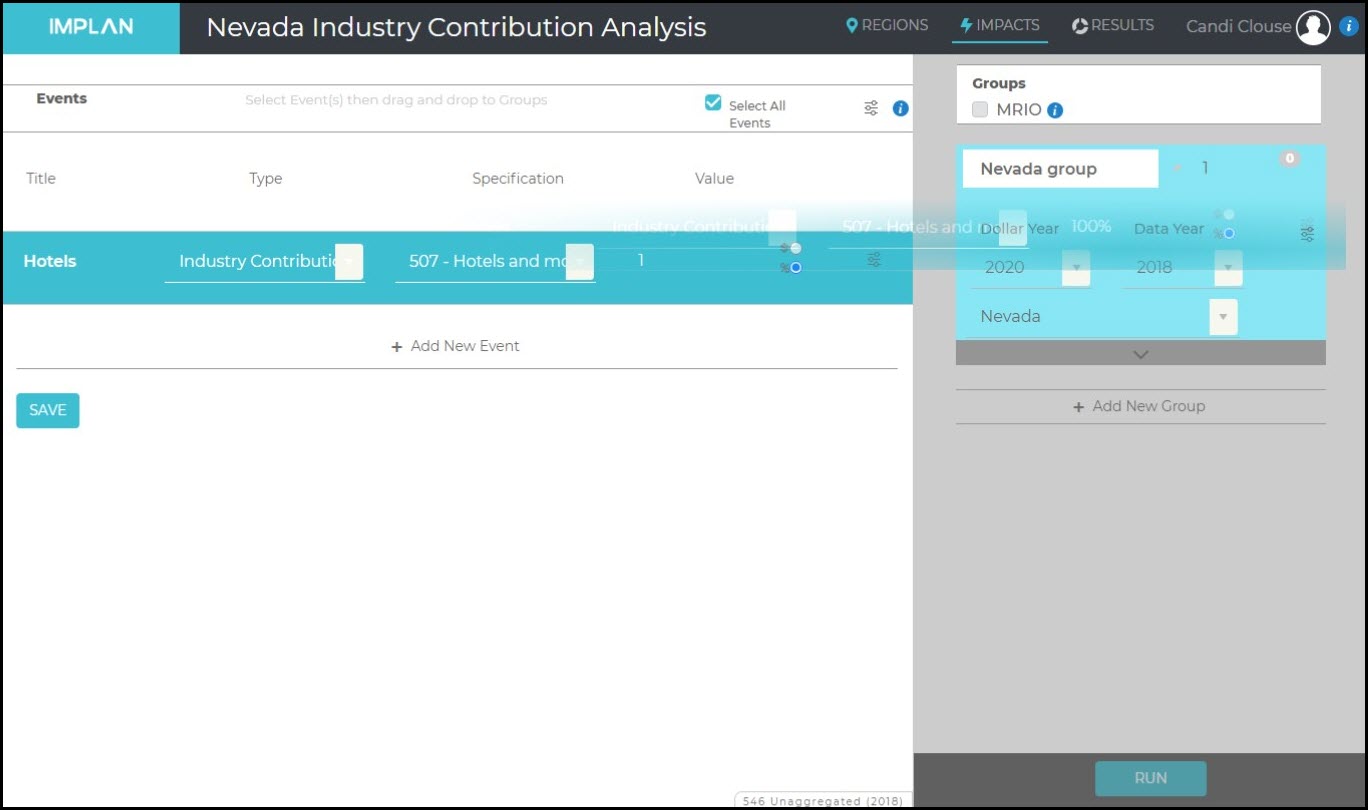
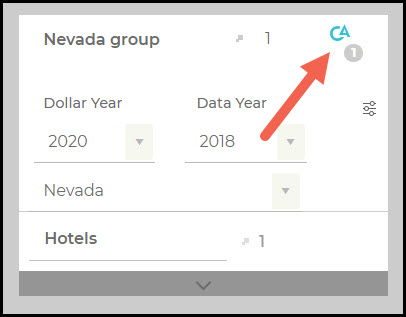
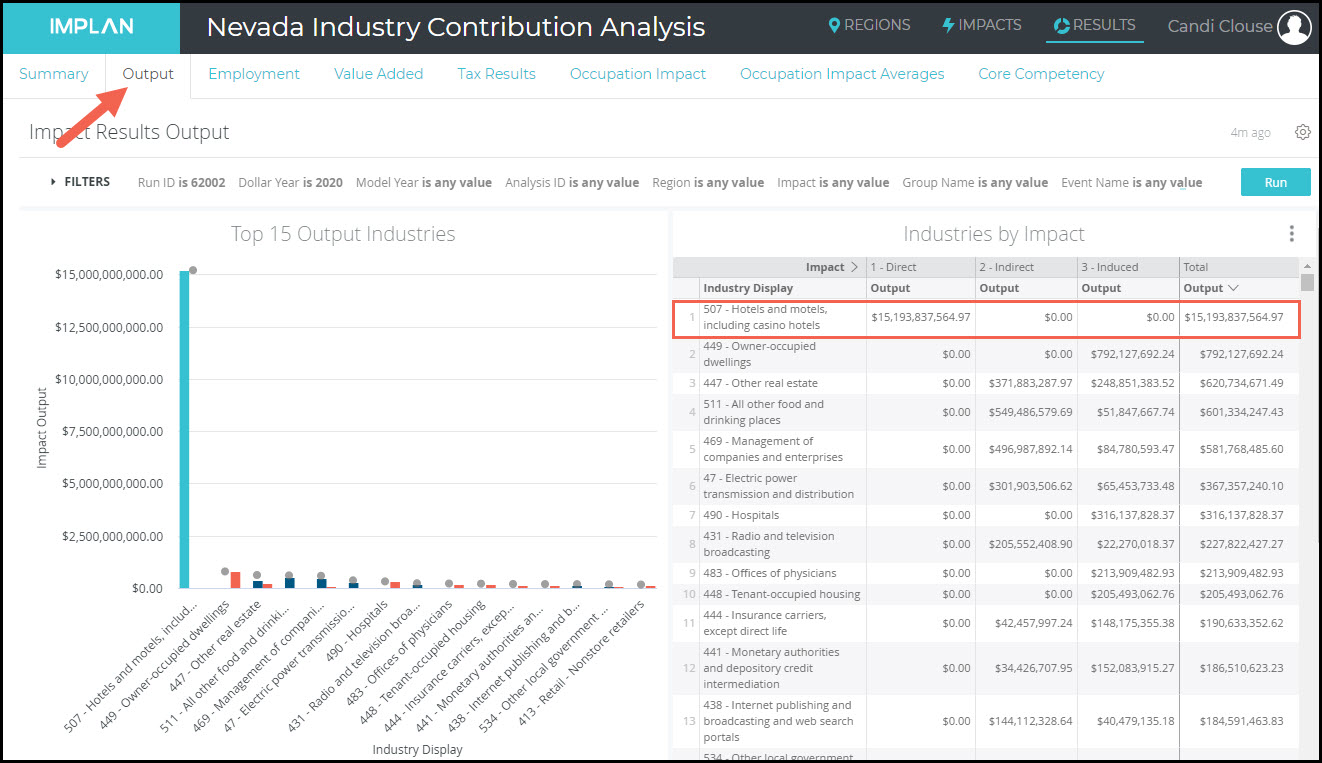
Industry Contribution Analysis with 1 Click

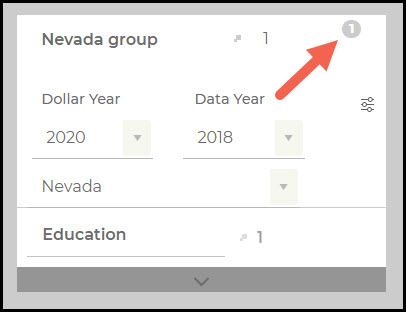
If you ever ran an Industry Contribution Analysis (ICA) or a Multi-Industry Contribution Analysis (MICA) in Pro, I am sorry. Based on the Hypothetical Extraction approach (Miller & Blair, 2009), this once tedious process is now just a simple Event selection. By choosing Industry Contribution Analysis as your Event Type, all the buybacks to the Industry or Industries that are included in your Group will be restricted. It’s that easy. In the results, the effects to the contributing Industries will be limited to Direct Effects that are equal to the Event Value(s) analyzed. 


Combine Areas with the Region List 

One of the newest features is the ability to combine Regions with just a few clicks, instead of the 99 clicks it previously took to create a Region for North Carolina less Mecklenburg County. The new Region List function is available for State, County, and Zip Code Regions allowing you to “select all” to get all the Counties within a State, for example.


IMPROVEMENTS

Updated Event Template

IMPLAN now allows users to upload any Event type using the Event Template in a streamlined spreadsheet far less quirky than previous versions. The sheet has one tab for each Event Type including Industry Contribution Analysis. You can even utilize Event Tags via this template. 


More Data in Region Details

There are some great additions to the data in Region Details. First, there is a new table called Industry Averages under Study Area Data. This table shows the average per worker values for components of Output; calculated as the value divided by Employment. Per worker values are calculated for Output, Labor Income, Employee Compensation, Proprietor Income, TOPI, and OPI. The Industry Detail table in Study Area Data now splits out Wage & Salary Employment from Proprietor Employment. There are also new tables for Occupation Data and Environmental Data.
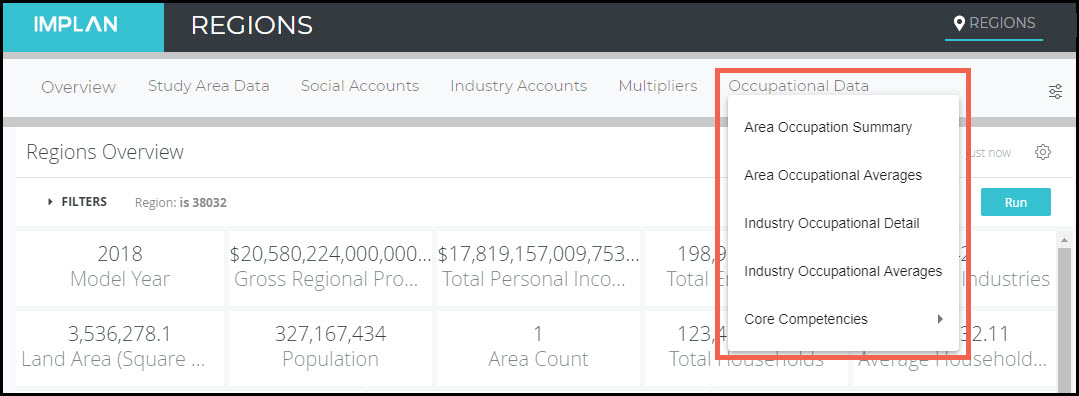
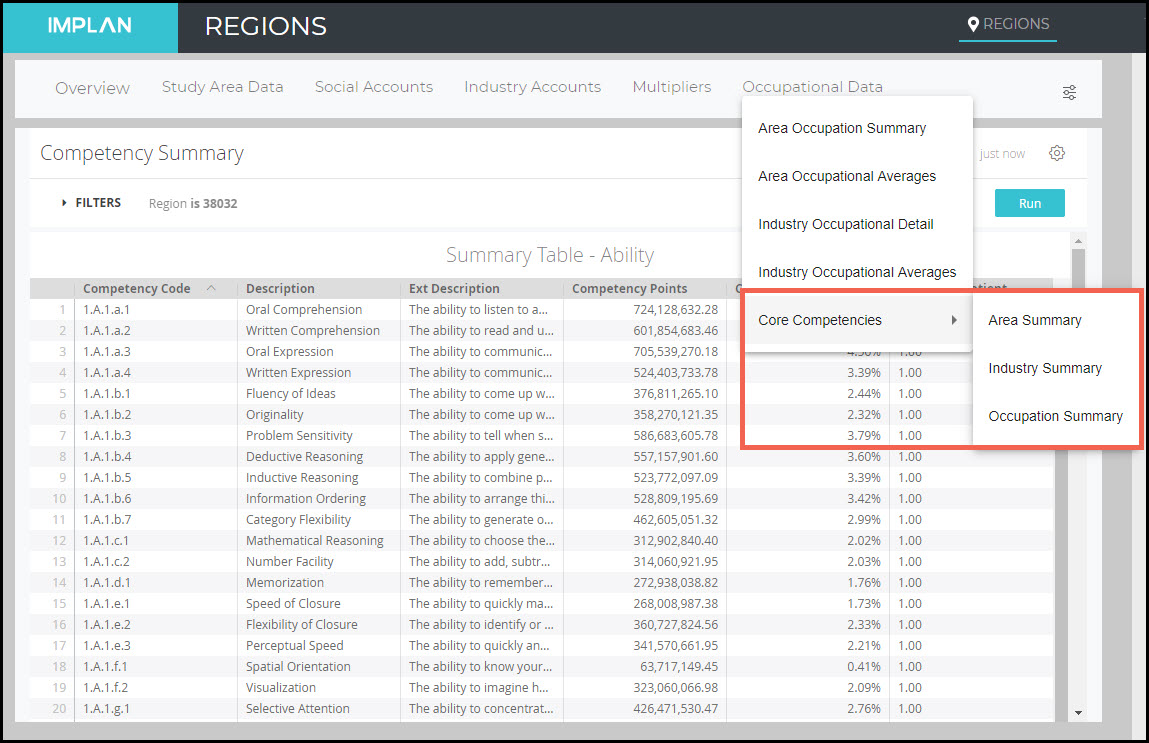
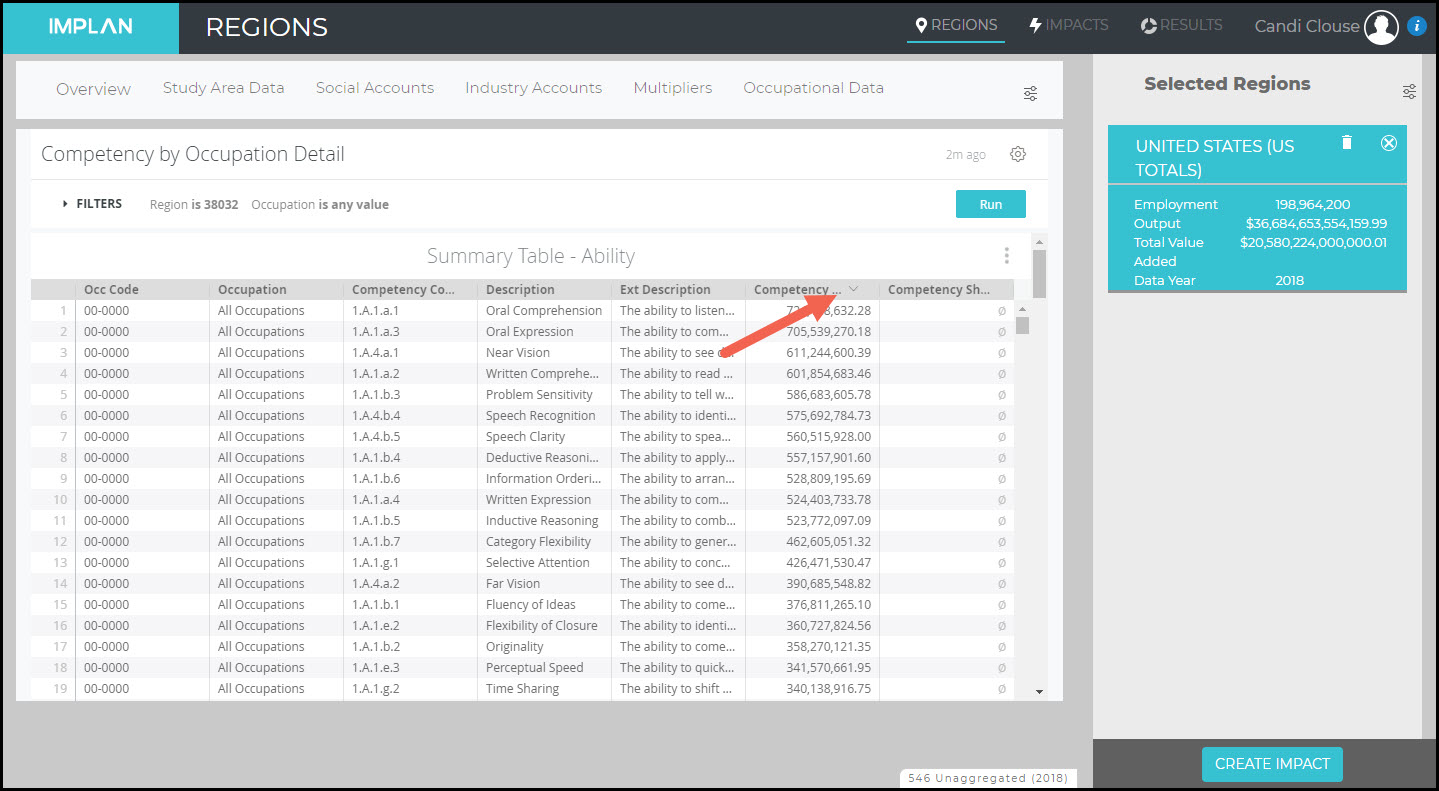
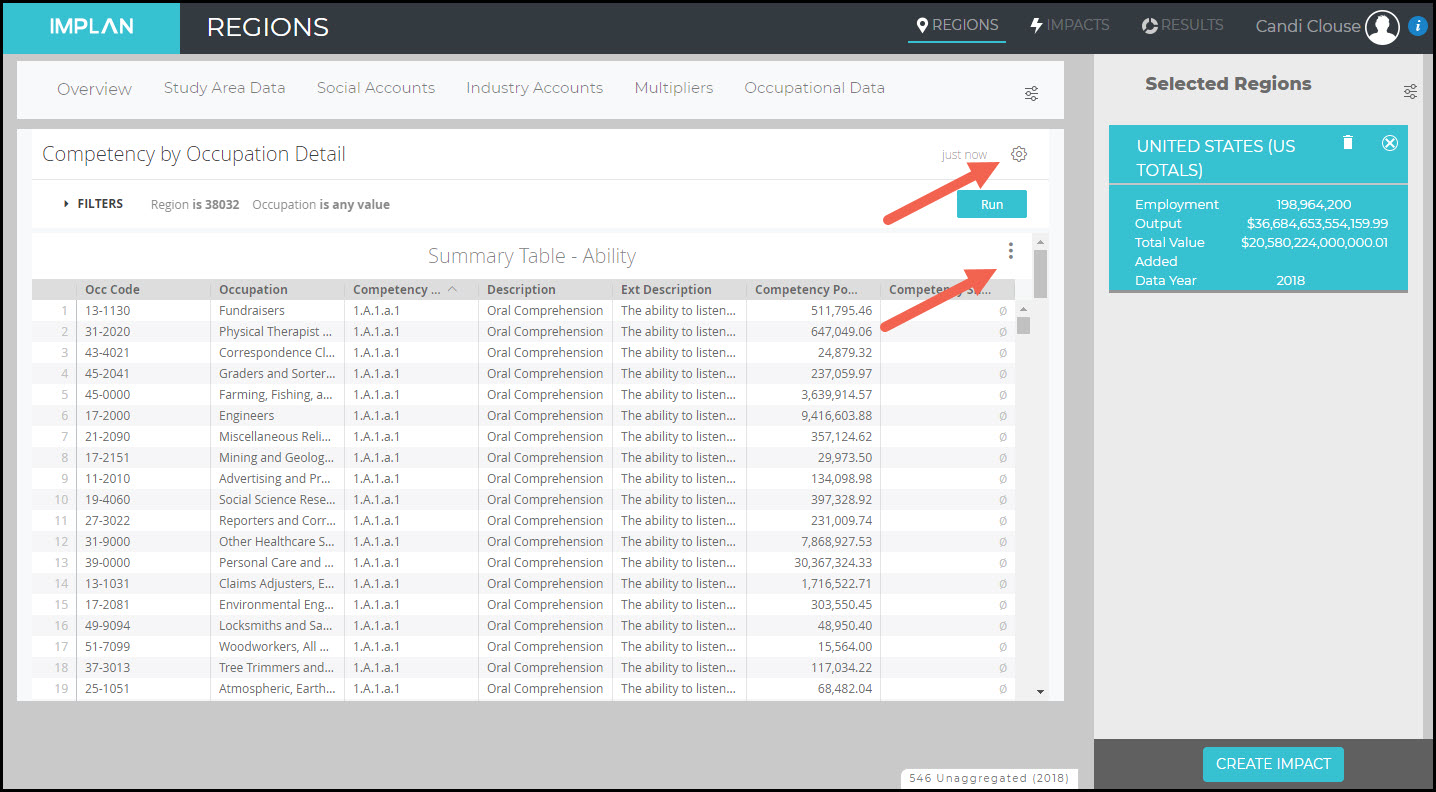
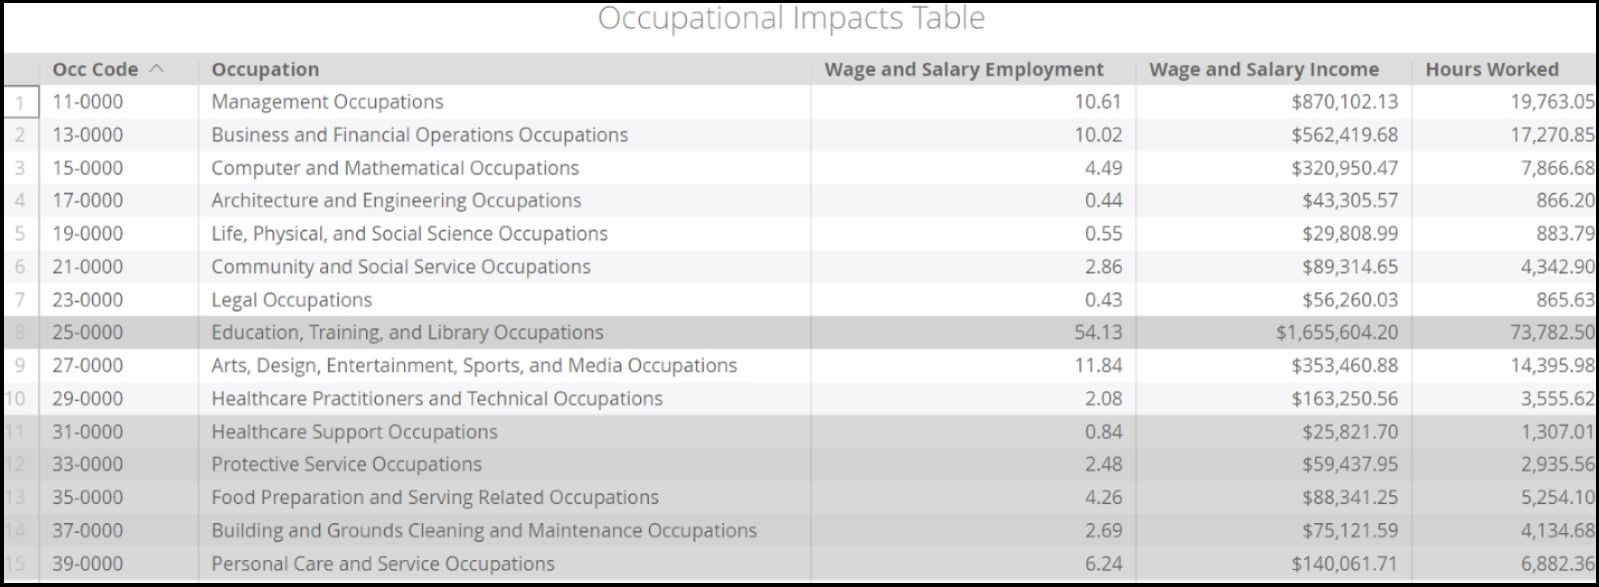
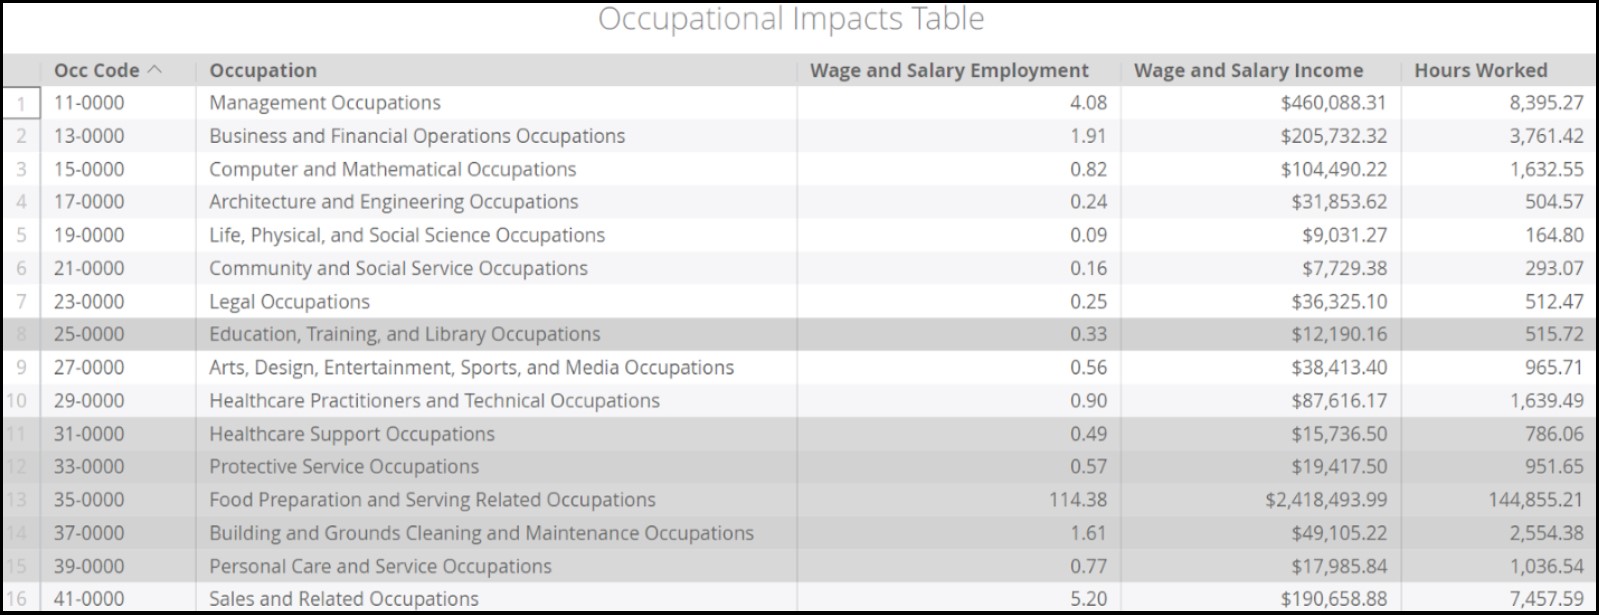
 

Occupation Data

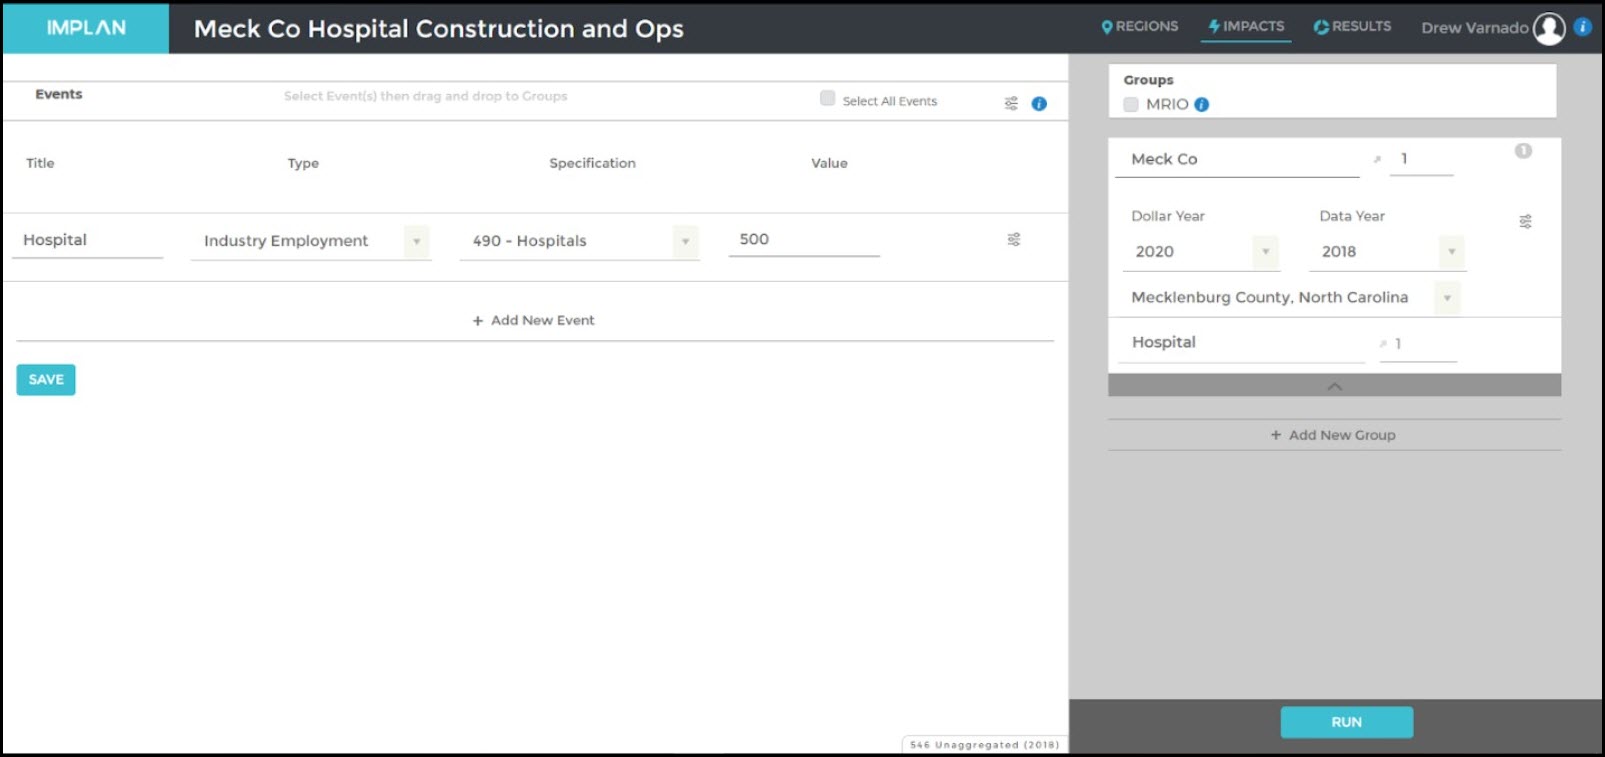
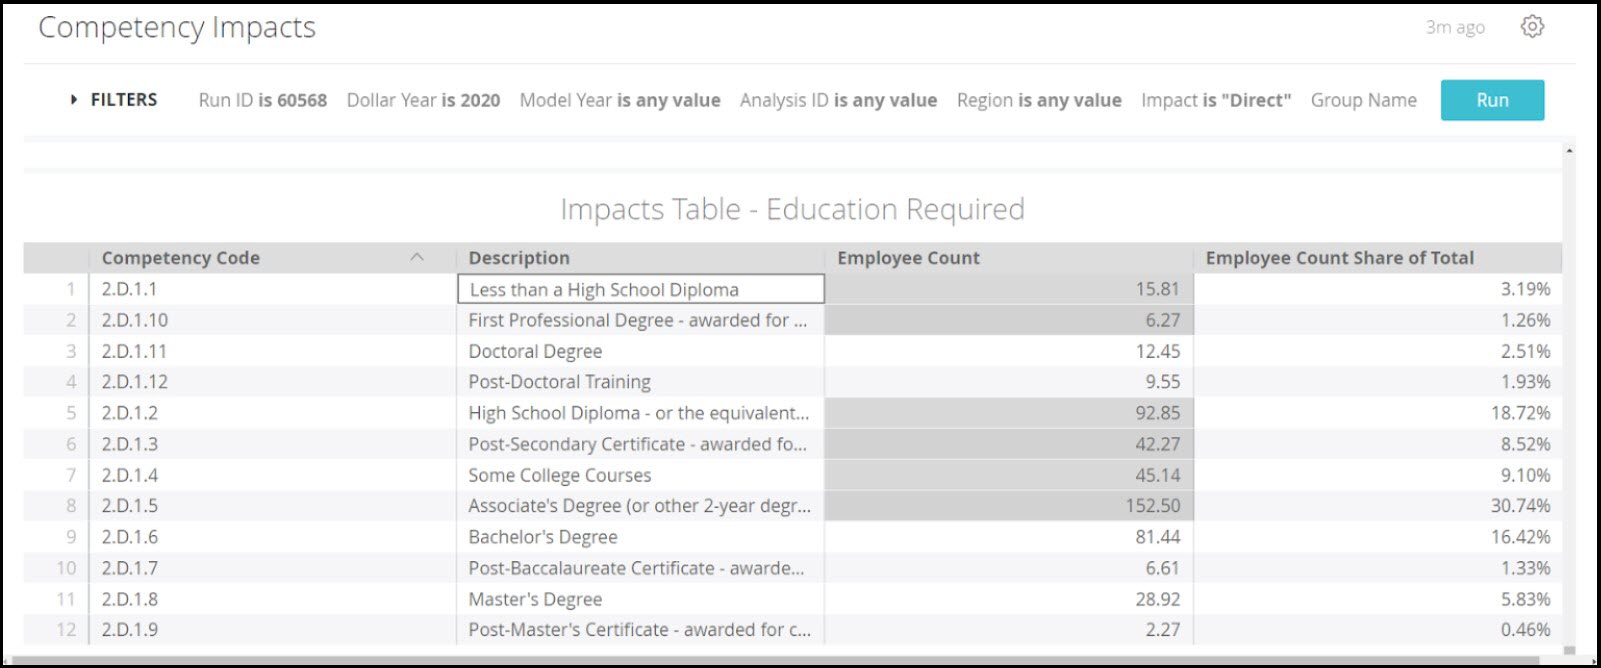
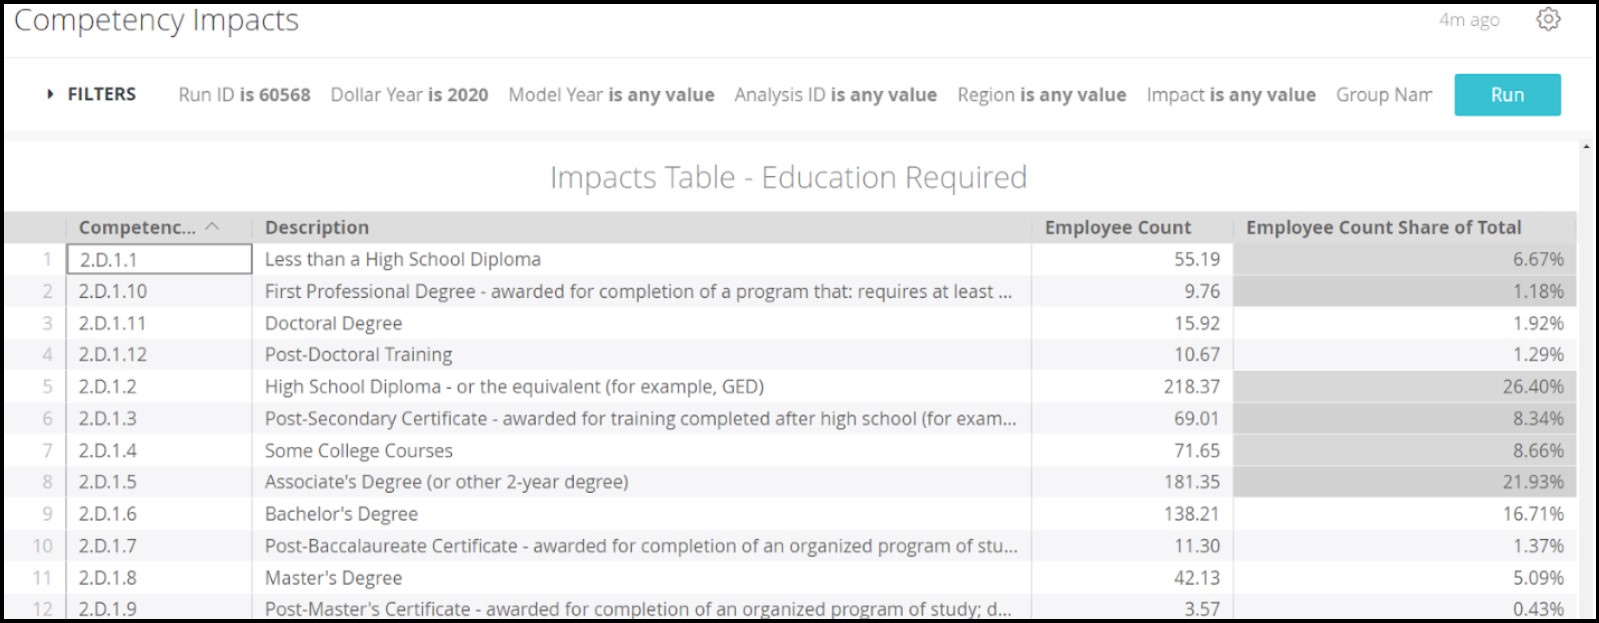
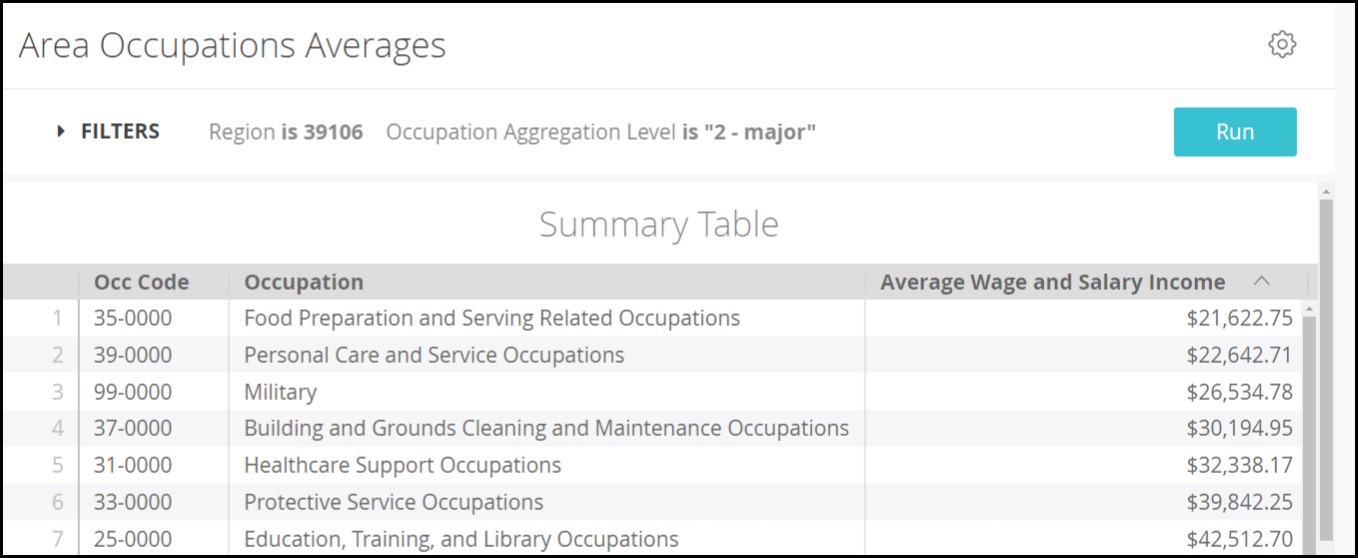
IMPLAN has added its occupation employment by industry data which shows estimates of occupation employment, wages, hours, and core competencies (including knowledge, skills, abilities, education, work experience, and on-the-job training levels) for over 800 different occupations. Access to Occupation Data makes these details available in the Region Details and Results of all Projects, including Projects using combined regions, customized regions, and aggregated industry schemes! The Occupation Data will even show up in all the Projects you ran previously.


Environmental Data

Environmental Data is now available in the IMPLAN application. Although it is national in nature, the data contains eight satellite accounts for different pollutants with detailed tags under each one. That national environmental Industry ratios are applied across all of the data available in IMPLAN. You can examine the environmental footprint of your region in Region Details and see the environmental impacts that are associated with your economic impacts!


Data Library

IMPLAN Data Library is a feature that allows users to compare data across Regions, Industries, and time. You can examine all of IMPLAN’s data from 2001-current including data on Commodities, Industries, Environmental, Occupation, Trade Flow, Tax, Core Competencies, Deflators, Demographics, and Employment & Wages by NAICS (Imputed CEW Data). Data Library is great when you want to compare any piece of IMPLAN data and show the Results in a table, map, or graph.


More Data Years

IMPLAN now displays data for 2001 all the way through the most current Data Year that can be examined with just a click of a drop down menu. That means you can examine the details of your Region in any Data Year, including the two special COVID datasets. You can also now choose your Region by typing the name or by clicking on the map. 

Due to programming limitations in Pro, the newest IMPLAN Industry Scheme can only display 544 instead of the full 546 Industries. IMPLAN includes a split between “hospitals and health services” and “other services” within state and local government entities that is not available in Pro. 


MRIO is Bigger and Better

The new version of IMPLAN comes with a few great improvements to Multi-Regional Input-Output (MRIO).  First off, it is now multi-angular. In IMPLAN Pro, MRIO allowed users to observe the ripple effects of impacts which are occurring in a specific economy throughout its neighboring economies. However, when doing this, the software is unable to let users observe any Direct Effects upon economies besides that in which the original Impact is occurring. Basically, you could link two Regions, but Events could only occur in one of them. So, despite offering insights into multiple economies, MRIO analyses were limited to a singular, outward perspective. Now, different Events can be entered in multiple linked Regions via MRIO. Using the Filters on the Results screen allows for the examination of the intricacies of these complicated analyses

The IMPLAN Product Team is always working on improvements to reduce the time necessary for large MRIO projects to run. Both Versions 5.16 and 6.2 brought performance enhancements to the run time. Now, more Events can be run in more Regions. 

Also, when using a Labor Income Change in IMPLAN Pro, the software incorrectly reported Indirect and Induced Impacts. Now, the Results from a Labor Income Event linked via MRIO correctly yield only Induced Results.


Improved SAMS & Multipliers

Social Accounting Matrices (SAMs) expand upon the traditional I-O tables to also include transactions between Industries and Institutions and between Institutions themselves, thereby capturing all monetary market transactions in a given time. The SAMs in IMPLAN Pro and IMPLAN Online reported commuting as net flows and sub-national SAMs consolidated all reported commuting into the Domestic Trade account. But, now SAMs report commuting as gross flows, meaning you can see total in-commuting and out-commuting at both state and county levels. Also, SAMs retain all reported foreign commuting within the Foreign Trade account.

When using MRIO in Pro, Employee Compensation sent to linked Regions for generating Induced Effects incorrectly failed to remove payroll tax before applying the commuting rate. This means that most of the time the Induced Effects were overstated. This is no longer the case.

These improvements to the SAMs, and therefore the multipliers, both make it easier to observe estimated commuting flows both into and out of economies and are more on target with regional economies. Some payments to governments have been reclassified in IMPLAN, like rents and royalties paid from Other Property Income (OPI) to governments rather than from Taxes on Production & Imports (TOPI). Such changes serve to align the new IMPLAN’s SAMs with National Income and Product Accounts (NIPAs) from the Bureau of Economic Analysis (BEA) to improve the quality of both tax and impact results.


Improved Trade Flows

Due to its internal consistency and ability to account for spatial variables like the proximity and size of alternative markets, the trade flow method is presumed to be superior to the econometric method for estimating regional RPCs. The IMPLAN National Trade Flows Model uses actual trade data and estimations and a Gravity Model. In IMPLAN Pro, it required extensive amounts of data to be stored locally. For this reason, the state and county models in IMPLAN Pro use this option (unless you specify otherwise), but the zip codes and the US total used Econometric RPC which allowed Pro to make estimates without using the gravity model.

The new version is based in the cloud so we don’t have this limitation. This means states, counties, and zip codes all use the gravity model method to produce trade flows. The options for Supply Demand Pooling and Econometric RPCs are considered inferior and therefore not a part of the newest version of IMPLAN. 


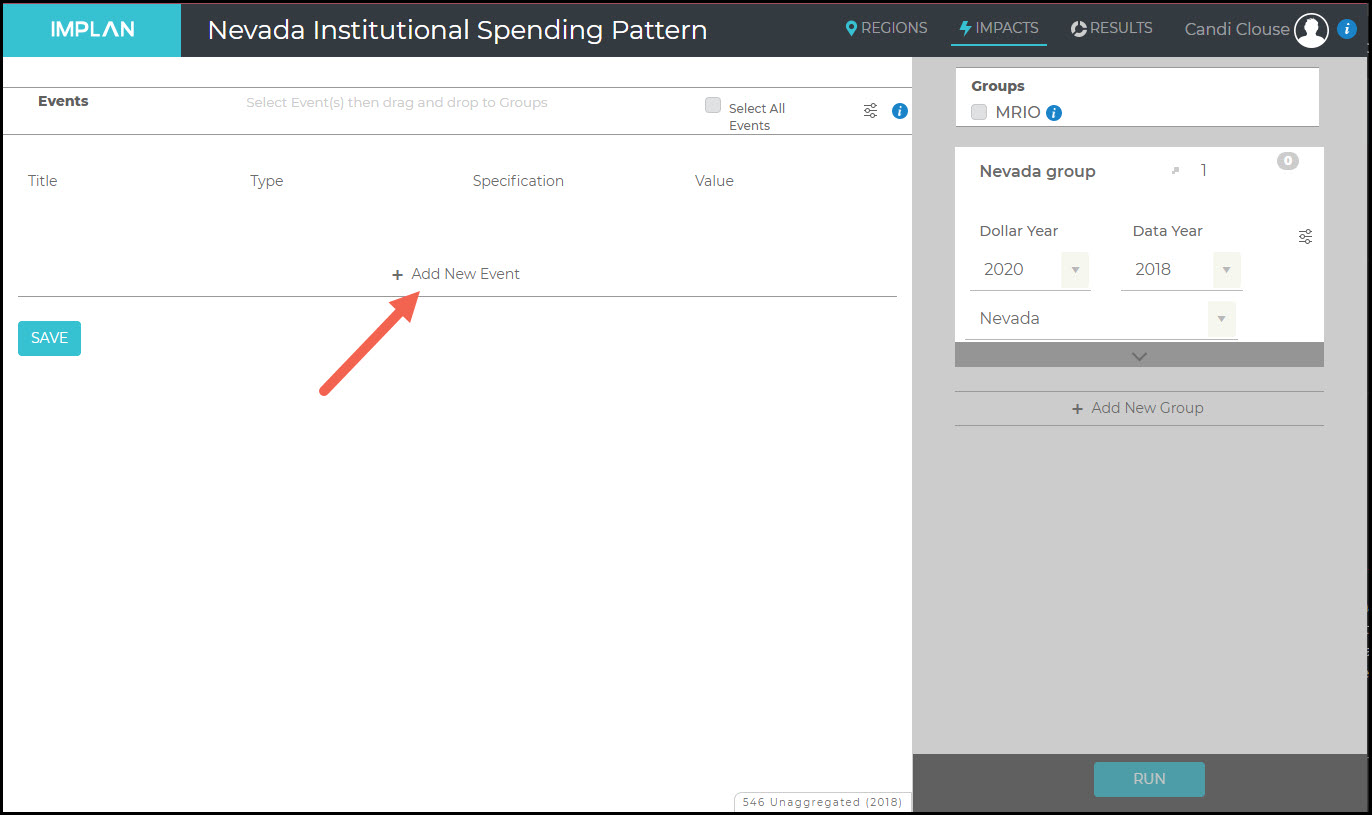
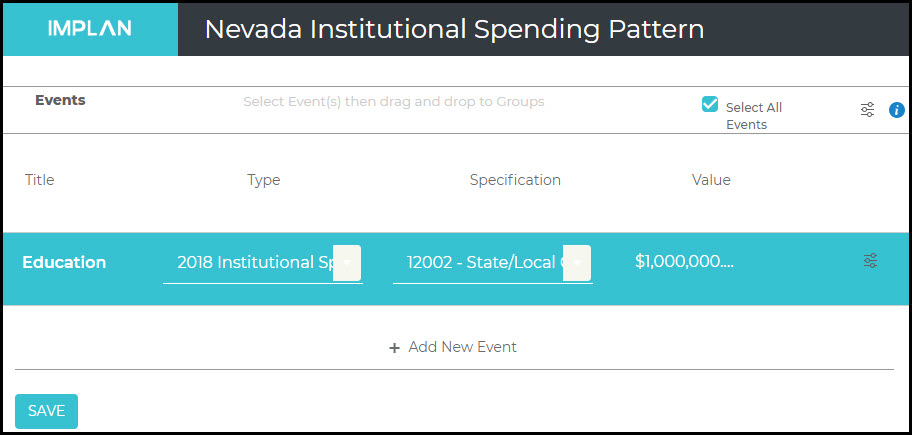
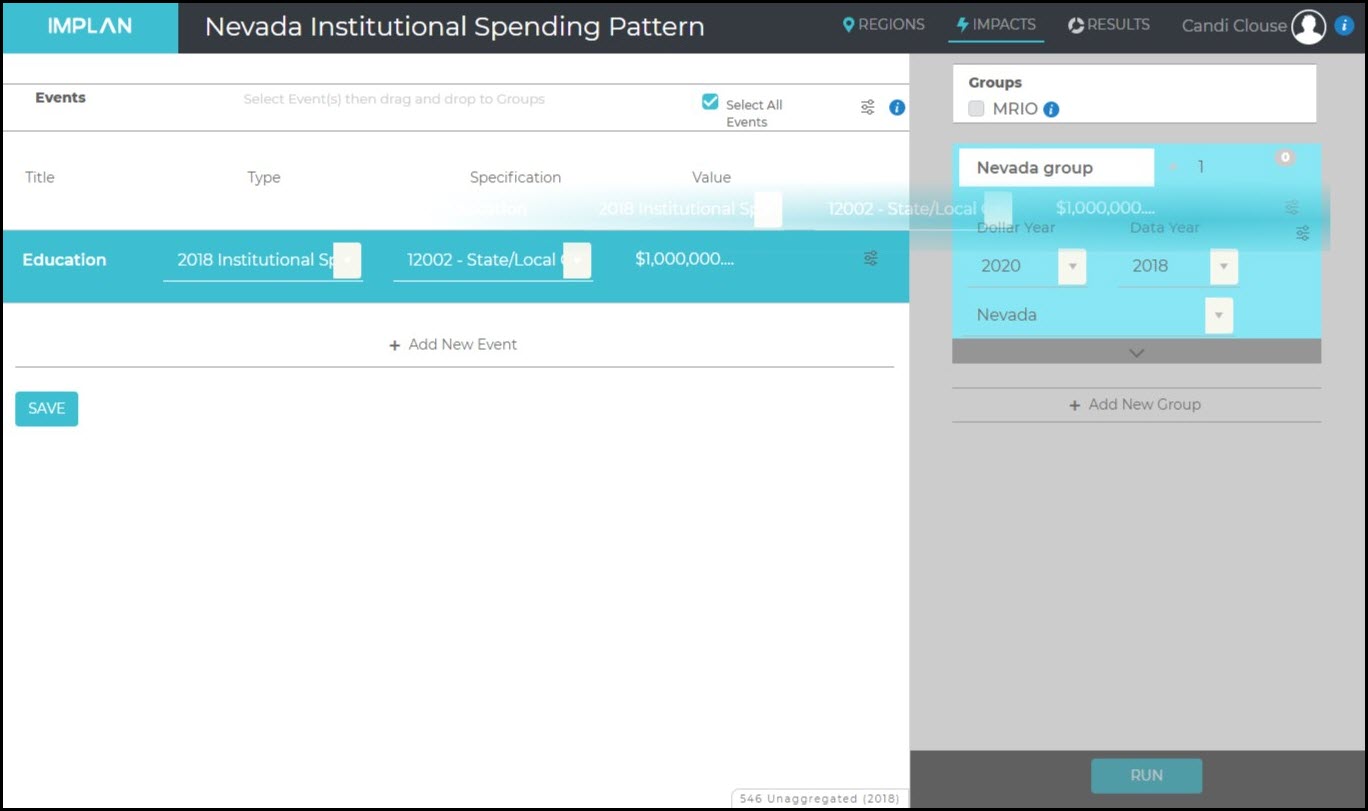
Easily Edit Industry Spending Patterns

In previous iterations of IMPLAN you had to import an industry spending pattern into the program itself, customize it to your liking, and then use that customized spending pattern as a proxy for your study’s selected IMPLAN Industry. Now, even that’s easier. To edit an industry spending pattern in IMPLAN, simply select Industry Spending Pattern as your study’s Event Type and then modify it to your liking. 


Name Changes

The new version of IMPLAN also brings some improvements to naming conventions. 

Old Name

New Name

Activity Type

Event Type

Industry Change

Industry Output

Industry Employment

Industry Employee Compensation

Industry Proprietor Income

Commodity Change

Commodity Output

Intermediate Expenditures

Intermediate Inputs

Other Property Type Income

Other Property Income

IMPLAN Sector

IMPLAN Industry


Improved Communication and Messaging

The IMPLAN Product Team is working to ensure that all functionality is up to your high standards. Occasionally issues do arise and we document all Known Issues. There is also a whole host of new error messages to help you navigate when something might be off. This is a big improvement over Pro asking if you would like to let IMPLAN know about the issue before it crashes, right? Spoiler: Pro never tells us anything.


Customized Support

Some IMPLAN users have built custom macros, automations, and reports using IMPLAN Pro. Many of these processes are targeted at exporting large amounts of data. For example, we have seen users who need to run the exact same scenario in a large group of Regions and export all of the Results. Still other users are looking to export model data like multipliers or per million dollar effects by Industry for a large number of Regions. IMPLAN is now capable of helping you with these processes through Data Services. That is, instead of working with macros around IMPLAN Pro files, our team can simply pull the data you’re looking for and send it to you in a variety of formats to help you get what you need quickly and easily reducing the time and effort needed to get your research moving. 

Our staff is here to help ensure that your transition is seamless. We can assist in setting you up with model building, project building, analysis processing, extracting results, pulling model data and other custom data services. Just email support@implan.com with your project details.

MORE TO COME

There are just a few things from Pro that our Product Team is working on adding to IMPLAN Version 6. Stay tuned as they are on the job. 

  • User Year Preferences – NEXT RELEASE
  • Total Value Added Multipliers – NEXT RELEASE
  • Support for 51 State MRIO Projects – NEXT RELEASE
  • Project Organization 
  • Leakages of Direct Effects on Results
  • Editing margins – check out the workaround
  • NAICS to IMPLAN Searching 
  • Batch processing


Occupation Data (Video): Primer Exercise & Exploration Guide


DOWNLOADS

Core Competencies

Occupation SOC Codes


RELATED ARTICLES

Occupation Data – Behind the i

Occupation Data Use Cases  

Using Occupation Data

Occupation Data Details

Occupation Data

INTRODUCTION

The Occupation Data header contains information about all of the Standard Occupational Classification (SOC) data in your Region. The SOC categorizes jobs into one of 823 detailed occupations which contains 459 broad groups, 96 minor groups, and 23 major groups. This article outlines descriptions of the terms and categories found within the tables. 

Occupation Data only includes Wage & Salary Employment. No Proprietor Employment is included.

Level

Name

Records

Total

All occupations

1

Major

2-digit

23

Minor

3-digit

96

Broad

4-digit

459

Detail

5-digit

823


WAGE & SALARY INCOME VS EMPLOYEE COMPENSATION

Wage & Salary income includes base salary and/or wages, employee paid social insurance tax, bonuses, stock options, severance pay, profit distributions, and reimbursements for meals and lodging. Employee Compensation (EC) includes all the above as well as the employer portion of social insurance tax, employer contributions to 401K, and reimbursements for special benefits, such as gym memberships. As EC includes all additional costs of employment, it is often described as the total cost of an employee (or of employees) to the employer or fully-loaded payroll. The difference between them is referred to as supplements to wage and salary income and includes the employer portion of social insurance tax, employer contributions to 401K, and reimbursements for special benefits.


FINDING THE DATA

You can locate the Occupation Data by navigating Behind the i on the Regions screen. The Occupation Data has its own tab full of useful information.

Occ_Behind_i_-_Header.jpg

AREA OCCUPATION SUMMARY

This table lists by-occupation data for the region. By default, occupations are presented at the detail level. Use the filter option to select one of the detail levels presented in the table at the beginning of this article.

  • Occ Code = occupation code
  • Occupation = description of the occupation
  • Wage and Salary Employment = regional wage and salary employment for the occupation; excluding Proprietors which are not included in IMPLAN’s occupation data
  • Wage and Salary Income = regional wage and salary income for the occupation 
  • Supplements to Wages and Salaries = value of benefits and bonuses paid to wage and salary workers; the difference between Employee Compensation and Wage and Salary Income
  • Employee Compensation = regional employee compensation for the occupation
  • Hours Worked = hours worked by the occupation
  • Location Quotient = wage and salary employment based location quotient for the occupation, as compared to the U.S. as a whole

AREA OCCUPATIONAL AVERAGES

This table lists by-occupation average data for the region. By default, occupations are presented at the detail level. Use the filter option to select one of the detail levels presented in the table at the beginning of this article.

  • Occ Code = occupation code
  • Occupation = description of the occupation
  • Average Wage and Salary Income = average wage and salary income for the occupation
  • Average Supplements to Wages and Salaries = average value of benefits and bonuses paid to wage and salary workers; the difference between Employee Compensation and Wage and Salary Income
  • Average Employee Compensation = average employee compensation for the occupation
  • Average Hours per Year = average hours worked per year for the occupation
  • Average Wage and Salary Income per Hour = average per hour rate of wage & salary income for the occupation (W&S/hours worked)
  • Average Supplements to Wages and Salaries per Hour = average per hour rate of supplements to wage & salary income for the occupation (supplements to W&S/hours worked)
  • Average Employee Compensation per Hour = average per hour rate of employee compensation for the occupation (EC/hours worked)


INDUSTRY OCCUPATIONAL DETAIL

This table lists by-industry by-occupation data for the Region. By default, occupations are presented for IMPLAN Industry 1 – Oilseed Farming. Use the Filter option to select a different Industry. 

  • Occ Code = occupation code
  • Occupation = description of the occupation
  • Wage and Salary Employment = regional wage and salary employment for the occupation; excluding Proprietors which are not included in IMPLAN’s occupation data
  • Wage and Salary Income = regional wage and salary income for the occupation 
  • Supplements to Wages and Salaries = value of benefits and bonuses paid to wage and salary workers; the difference between Employee Compensation and Wage and Salary Income
  • Employee Compensation = regional Employee Compensation for the occupation
  • Hours Worked = hours worked by the occupation
     

INDUSTRY OCCUPATIONAL AVERAGES

This table lists by-industry by-occupation average data for the Region. By default, occupations are presented for IMPLAN Industry 1 – Oilseed Farming. Use the Filter option to select a different Industry. 

  • Industry Code = IMPLAN Industry Code
  • Description = description of the IMPLAN Industry
  • Occ Code = occupation code
  • Occupation = description of the occupation
  • Average Wage and Salary Income = average wage and salary income for the occupation
  • Average Supplements to Wages and Salaries = average value of benefits and bonuses paid to wage and salary workers; the difference between Employee Compensation and Wage and Salary Income
  • Average Employee Compensation = average employee compensation for the occupation
  • Average Hours per Year = average hours worked per year for the occupation
  • Average Wage and Salary Income per Hour = average per hour rate of wage & salary income for the occupation(W&S/hours worked)
  • Average Supplements to Wages and Salaries per Hour = average per hour rate of supplements to wage & salary income for the occupation(supplements to W&S/hours worked)
  • Average Employee Compensation per Hour = average per hour rate of employee compensation for the occupation (EC/hours worked)


CORE COMPETENCIES

Occ_Behind_i_-_Core_Competencies.jpg

AREA SUMMARY

These tables summarize the regional composition of each competency. 

Ability, Knowledge, and Skills

  • Competency Code = Unique competency identifier from O*Net competency codes
  • Description = Competency description from O*Net competency descriptions 
  • Ext Description = further details on the competency description
  • Competency Points = The sum of competency points are a measure of the human capital endowments in the Region given the current occupation mix of Employment in the Region. For more information on how competency points are calculated, see the article Occupation Data Details.
  • Competency Share of Total = A measure of the relative size of a competency when compared to the total sum of like competencies; how important this competency is compared to other like competencies. Example formula (Ability: Oral Comprehension Competency Points / Sum of Ability Comprehension Points). 
  • Location Quotient = Competency based location quotient as compared to the U.S. as a whole

Education Required, Work Experience Required, and On-the-Job Training

  • Competency Code = Unique competency identifier from O*Net competency codes 
  • Description = Competency description from O*Net competency descriptions
  • Employee Count = The sum of Wage and Salary employees estimated to exhibit the specified competency. For more information, see the article Occupation Data Details.
  • Employee Count Share of Total = A measure of the percent of total wage and salary employees that exhibit the given competency.
  • Location Quotient = Wage and Salary Employee count based location quotient as compared to the U.S. as a whole


INDUSTRY SUMMARY

These tables summarize the regional composition of each competency by industry. Use the filter to switch which industry’s information is displayed as Industry 1 – Oilseed farming will be displayed by default.

Ability, Knowledge, and Skills

  • Industry Code = IMPLAN Industry code
  • Description = IMPLAN Industry description
  • Competency Code = Unique competency identifier from O*Net competency codes 
  • Description = Competency description from O*Net competency descriptions
  • Ext Description = further details on the competency description
  • Competency Points = The sum of competency points are a measure of the human capital endowments in the Region given the current occupation mix of Employment in the Region. For more information on how competency points are calculated, see the article Occupation Data Details.
  • Competency Share of Total = A measure of the relative size of a competency when compared to the total sum of like competencies; how important this competency is compared to other like competencies. Example formula (Ability: Oral Comprehension Competency Points / Sum of Ability Comprehension Points). 

Education Required, Work Experience Required, and On-the-Job Training

  • Industry Code = IMPLAN Industry code
  • Description = IMPLAN Industry description
  • Competency Code = Unique competency identifier from O*Net competency codes
  • Description = Competency description from O*Net competency descriptions
  • Employee Count = The sum of Wage and Salary Employees estimated to exhibit the specified competency. For more see the article Occupation Data Details.
  • Employee Count Share of Total = A measure of the percent of total Wage and Salary Employees that exhibit the given competency.

OCCUPATION SUMMARY

These tables summarize the regional composition of each competency by occupation. Use the filter to switch which occupation’s information is displayed.

Ability, Knowledge, and Skills

  • Occ Code = occupation code
  • Occupation = description of the occupation
  • Competency Code = Unique competency identifier from O*Net competency codes 
  • Description = Competency description from O*Net competency descriptions
  • Ext Description = further details on the competency description
  • Competency Points = The sum of competency points are a measure of the human capital endowments in the Region given the current occupation mix of Employment in the region. For more information on how competency points are calculated, see the article Occupation Data Details.
  • Competency Share of Total = A measure of the relative size of a competency when compared to the total sum of like competencies; how important this competency is compared to other like competencies. Example formula (Ability: Oral Comprehension Competency Points / Sum of Ability Comprehension Points). 

Education Required, Work Experience Required, and On-the-Job Training

  • Occ Code = occupation code
  • Occupation = description of the occupation
  • Competency Code = Unique competency identifier from O*Net competency codes 
  • Description = Competency description from O*Net competency descriptions 
  • Employee Count = The sum of wage and salary employees estimated to exhibit the specified competency. For more information, see the article Occupation Data Details\
  • Employee Count Share of Total = A measure of the percent of total Wage and Salary Employees that exhibit the given competency

SORTING

The title bar displayed across the top of each table contains buttons that can change the viewing attributes. Clicking next to the name in the grey box will sort the column of interest either in ascending (first click) or descending (second click) order.

Occ_Behind_i_-_Sort.jpg


DOWNLOADING

The export function allows data to be exported directly to a PDF or CSV file by clicking on the gear icon. Clicking on the ellipses will download each table individually.

Occ_Behind_i_-_Download.jpg


DOWNLOADS

Core Competencies

Occupation SOC Codes


RELATED ARTICLES

Occupation Data Details

Using Occupation Data in IMPLAN

Occupation Data Use Cases 

Occupation Data Use Cases

DEVELOPING TARGETED JOB TRAINING INITIATIVES WITH REGIONAL STRENGTHS & WEAKNESSES

Preparing the local workforce to fill the jobs that local businesses have open (or will have open in the future) can help close the economic loop within a regional economy. That is, the ideal situation would be for local jobs to be filled by local workers. This helps close the regional loops by preventing wage leakage due to commuting and by grounding local businesses within the community. Whether it is the local community college, job skills training programs, or vocational up-training programs it’s important that there is alignment between the training received by workers and the skills needed by local businesses. The goal of this article is to demonstrate how a community can evaluate the types of jobs in the local economy, the skills needed to fill those jobs, and the expected wages of those jobs so that local education partners can train local workers to fill them and keep more talent, more businesses, and more money in the local economy. Check out the article on Location Quotients to learn how the Occupational LQs can help inform these decisions: What can an LQ do for you?


EMPLOYMENT REQUIREMENTS: NEW HOSPITAL OPERATIONS

Whatever your impact or contribution, one of the most valuable ways to tell your story comes from the jobs your activity supports. Whether it’s by directly employing people, the jobs your activity supports through your supply chain, or through jobs supported by wage spending, jobs are one of the most tangible and important measures of your impact or contribution. 

As an example, let’s consider a new hospital being built in Mecklenburg County, NC. This is a new, state-of-the-art, hospital in an underserved  urban area. Once the hospital is finished it will employ 500 workers. The company building and operating the hospital would like to show the County Board of Commissioners what the Economic Impact will be of the operations of the hospital. The Board of Commissioners has said that in addition to creating economic impacts, they will need to show that at least 40% of the 500 expected jobs (or at least 200 jobs) at the hospital will go to workers who have education levels less than a bachelor’s degree in order to qualify for certain requirements for tax exemptions.

Framing a full economic impact of a hospital is covered in detailed articles on Construction and Hospitals, so here we will keep things simple and focus on fulfilling the requirement of 40% of jobs going to a workforce with less than a bachelor’s degree. After setting up and running our analysis, we can use the Occupation Data to determine what the education level is of the workers expected for the hospital. Here’s how this project looks on the Impact screen:


Occ_Uses_-_Hosp_Set_Up.jpg

By looking at the Core Competencies on the Results tab of our analysis, we can find the Education table below that shows the distribution of the education levels of the Direct Jobs.


Occ_Uses_-_Hosp_Emp.jpg

Adding up the workers at education levels below “Bachelor’s Degree” the firm is able to show that they expect more than 350 of the 500 (or more than 70%) of the jobs at the hospital to go to workers who have education levels less than a Bachelor’s Degree. 

Additionally, if we include not only the 500 Direct Jobs in the hospital, but ALL jobs through the supply chain and support through the spending of wages (i.e. Direct, Indirect, and Induced jobs), we can see that more than 70% of the nearly 800+ jobs in Mecklenburg County supported by the operations of the hospital are expected to go to workers who have less than a Bachelor’s Degree. This means that the hospital more than doubles the requirements for the tax exemption, which is sure to make the Board of Commissioners quite happy!


Occ_Uses_-_Hosp_Emp_2.jpg


EVALUATING DIFFERENT OCCUPATION OPPORTUNITIES (NMTC)

New market tax credits are powerful incentives that the economic development community can use to entice new businesses or encourage business retention within the local economy. However, it can be difficult to understand what different opportunities bring to the local economy. This section demonstrates how analysts might compare two (or more) economic development opportunities in terms of the numbers, types, and wages of the jobs that would be expected to  accompany them.

Let’s say the IMPLAN Economic Development Corporation™ has received approval from Mecklenburg County, NC to provide a New Market Tax Credit (NMTC) to a new business being brought into the county. The objective of the NMTC is to provide more jobs in the county for low-skill, low-income workers in coordination with affordable housing projects in progress. So, the requirements for the NMTC are that the project must support at least 100 jobs in occupations that make an average wage of less than $45,000 per year in Mecklenburg County.

There are two applications for the NMTC. The first application is for a Restaurant Co-op which would house four different restaurants and will employ a total of 125 people. The other application is for a retail business which provides tutoring, test preparation, and other educational services which will employ 225 people. Here’s how this looks on the Impacts screen:

Occ_Uses_-_NMTC_1.jpg

Looking at the Occupation Data in IMPLAN for Mecklenburg County, we can see there are 7 major occupation categories that have an average annual wage of less than $45,000.

Occ_Uses_-_NMTC_2.jpg

Food preparation workers and education services workers are both in this group. Since we know the education services business is planning to employ 100 extra employees, we could reasonably expect that it may produce more jobs with wages below $45,000. However, with the new Occupation Data in IMPLAN we can actually look at these individual occupations and how many jobs are in each category. 

First, let’s look at the jobs breakdown for the Education Services Business:

Occ_Uses_-_NMTC_3.jpg

Next, let’s take a look at the breakdown for the Restaurant Co-op.

Occ_Uses_-_NMTC_4.jpg

Digging deeper into the occupational distribution of the jobs supported by these projects it’s apparent that the restaurant co-op project is likely to produce more jobs with annual salaries below $45,000, even though the education services business is going to initially employ 100 more people. 

Using this type of analysis can help guide local development groups towards policy that are more aligned with their stated goals. Let’s hope the four new restaurants are fantastic. Maybe we’ll finally get that good Thai food restaurant we’ve been hoping for!

Occupation

Average Annual Wage

Jobs Supported by the Restaurant Co-Op

Jobs Supported by the Education Services

Food Preparation and Service Related Occupations (35-0000)

$21,622.75

114.38

4.26

Personal Care and Service Workers (39-0000)

$22,642.71

0.77

6.24

Military (99-0000)

$26,534.78

0

0

Building and Grounds Cleaning and Maintenance Occupations (37-0000)

$30,194.95

1.61

2.69

Healthcare Support Occupations (31-0000)

$32,338.17

0.49

0.84

Protective Service Occupations (33-0000)

$39,842.25

0.57

2.48

Education, Training, and Library Occupations (25-0000)

$42,512.70

0.33

54.13

TOTAL JOBS

118.15

70.64


BUSINESS LOCATION OR EXPANSION

As organizations look to expand, locate, or relocate, one of the primary questions they must answer is how prospective areas match the labor force needs of the business. That is, are the workers needed by the business available in the area? What are the differences in wages between workers in one area versus another? The answers to these questions often play a crucial role in the decision-making process for business evaluating location decisions. This section demonstrates how this type of analysis can be done using the IMPLAN application and the Occupation Data within it. 

As an example, let’s consider a financial consulting firm that wants to expand its operations into North Carolina. The firm is considering Charlotte, Raleigh, and Asheville as possible locations. They would like to know how many Accountants, Actuaries, Bookkeepers, and Financial Analysts are in each of those areas and how much each makes on average. 

Charlotte is located in Mecklenburg County, Raleigh is in Wake County, and Asheville is in Buncombe County, so we’ll use those three counties as the Regions for this analysis.

The Occupation Codes for each of the interested jobs are in the table below (broad categories).

Occupation Common Name

SOC Code

SOC Code Description

Accountants

13-2010

Accountants and Auditors

Actuaries

15-2010

Actuaries

Bookkeepers

43-3030

Bookkeeping, Accounting, and Auditing Clerks

Financial Analysts

13-2050

Financial Analysts and Advisors

For each of these Occupations, the firm would like to know the number of wage and salary employees, the annual take-home wages, and the location quotient in each of three identified counties. This will help them understand how each of the proposed laborsheds are prepared to accommodate the needs of the firm. Using the data Behind the i on the Regions screen, we can gather the data requested and display it in the tables below.

Buncombe County

Occupation

Location Quotient

Wage and Salary Employment

Average Wage and Salary Income

Financial Analysts and Advisors

0.64

380

$109,403.72

Bookkeeping, Accounting, and Auditing Clerks

0.94

1,431

$36,831.00

Actuaries

0.42

8

$98,672.70

Accountants and Auditors

0.86

1,048

$67,457.31


Mecklenburg County

Occupation

Location Quotient

Wage and Salary Employment

Average Wage and Salary Income

Financial Analysts and Advisors

2.10

6,608

$179,280.94

Bookkeeping, Accounting, and Auditing Clerks

1.21

9,752

$57,625.92

Actuaries

1.75

175

$165,185.81

Accountants and Auditors

1.40

9,078

$113,093.86


Wake County

Occupation

Location Quotient

Wage and Salary Employment

Average Wage and Salary Income

Financial Analysts and Advisors

1.06

2,696

$135,293.58

Bookkeeping, Accounting, and Auditing Clerks

1.05

6,848

$48,785.09

Actuaries

1.18

95

$153,844.24

Accountants and Auditors

1.16

6,089

$92,513.26

From these data, the firm can see that there simply aren’t enough of the workers they would need in Buncombe County and thus Asheville would not be a wise place to locate. However, both Mecklenburg and Wake Counties have Location Quotients above 1.00, implying that these occupations are more available in these counties than the U.S. average. That means both counties are generally well stocked with the workers this firm would need.

Further, between Mecklenburg and Wake Counties there is a trade off to consider. Mecklenburg County has more employees in every relevant occupation than does Wake County. However, those workers all earn more income in Mecklenburg County, implying that labor costs of the firm would be higher in Mecklenburg County than costs for the same amount of workers in Wake County. The firm will now have to decide whether the increased availability of workers in Mecklenburg are worth the projected increased costs. 

This type of analysis provides the firm with data upon which to make sound planning decisions about where the new operation should be located.


DOWNLOADS

Core Competencies

Occupation SOC Codes


RELATED ARTICLES

Occupation Data Details

Using Occupation Data in IMPLAN

Occupation Data – Behind the i

Using Occupation Data in IMPLAN

INTRODUCTION

IMPLAN has added its occupation employment by industry data to the IMPLAN application. This dataset shows estimates of occupation employment, wages, hours, and core competencies which include knowledge, skills, abilities, education, work experience, and on-the-job training levels for each of 823 different occupations. Occupation data is available for all models, including models of combined regions, aggregated industry models, and customized models. Occupation data will match the current Data Year in IMPLAN (ie 2018 Data Year will show 2018 Employee Compensation).

There are two different types of Occupation Data that are useful during your analysis: Regional Occupation Data and Occupation Impact Data. 

Regional Occupation Data shows the Occupations, Wages, and Core Competencies that are already present in the Region you are studying. You can find this data Behind the i on the Region page. 

Occupation Impact Data shows the details for the Occupations, Wages, and Core Competencies that accompany your specific impact or contribution.


DETAILS

Occupation data can be used to examine study area data to gain important insights into a Region’s existing labor force, the skill requirements of various Industries, and more. The Occupation Data can also be seen in the Results of any impact or contribution analysis run within the IMPLAN application.

The data levels generally correspond to the BLS’s Standard Occupational Classification (SOC) codes. Major is the most aggregated, followed by Minor, Broad, and Detail. All data is based on national averages but brought to the regional level in IMPLAN. As with Employment, you may see fractional Occupations, especially for small firms where a few employees are spread across multiple Occupations.

The SOC categorizes occupations into one of 823 detailed occupations which contains 459 broad groups, 96 minor groups, and 23 major groups. 

Level

Name

Records

Example

Total

All occupations

1

All Occupations

Major

2-digit

23

51-0000 – Production Occupations

Minor

3-digit

96

51-7000 – Woodworkers

Broad

4-digit

459

51-7030 – Model Makers and Patternmakers, Wood

Detail

5-digit

823

51-7032 – Patternmakers, Wood


WHERE TO FIND OCCUPATION DATA

REGIONS OVERVIEW

The tables located in the Regions Overview provide insight into the model Region’s occupation makeup. Descriptions of the data found here are detailed in our Occupation Data – Behind the i article.


Occ_Behind_i_-_Header.jpg

IMPACTS

Distributions of occupation employment, wage, and core competencies are applied only to regional and results data. At this time, you cannot run impacts based on occupations.

RESULTS

The Occupation Impact Data shows the details for the Occupations, Wages, and Core Competencies that accompany your specific impact or contribution in the Results tab. Descriptions of the data found here are detailed in our Occupation Data – Behind the i article.


Occ_Uses_-_Results_Header.jpg

The Occupation Impact Tab opens the Occupation Impacts screen containing a single table detailing regional employment and wage impacts by-occupation. Use the Filters to limit results to desired Region, Group, Event, and Industry. The Filter can also be used to select a different occupation aggregation level. 

The Occupation Impact Averages tab opens the Occupation Impacts screen containing a single table detailing the average regional employment and wage impacts by-occupation. Use the Filters to limit results to desired Region, Group, Event, and Industry. The Filter can also be used to select a different occupation aggregation level. 

Core Competency opens the Competency Impacts screen containing tables for each core competency category (Ability, Knowledge, Skills, Education Required, Work Experience Required, On-the-Job Training Required). Use the Filters to limit results to desired Region, Group, Event, Industry, and occupation. The filter can also be used to select a different occupation aggregation level. 


DOWNLOADS

Core Competencies

Occupation SOC Codes


RELATED ARTICLES

Occupation Data Details

Occupation Data Use Cases 

Occupation Data – Behind the i

Institutional Spending Pattern Events

INTRODUCTION

Institutional Spending Patterns, like all Spending Patterns, are made up of a list of Commodities, although Institutional Spending Patterns include government payroll Commodities to capture spending on Labor. Because Institutions are Final Demanders, in the case of Institutional Spending Patterns, each Commodity in the Spending Pattern is treated like a Commodity Output Event and will create a Direct Effect.

Event Type

Institutional Spending Patterns 

Event Use

Analyzing general fiscal spending changes

Event Specification

”WHO” 

Federal Government NonDefense

Federal Government Defense

Federal Government Investment

State/Local Govt. Other Services

State/Local Govt. Education

State/Local Govt. Hospital & Health

State/Local Govt. Investment

Capital

Inventory Additions/Deletions

Event Value

“WHAT” 

Total Spending on Goods, Services and Labor


INSTITUTIONAL SPENDING PATTERN EVENTS

IMPLAN can be accessed via app.IMPLAN.com. Once you are logged in, you will be directed to the IMPLAN dashboard. From the dashboard you can navigate to the Regions, Impacts, or Projects screen. 

IMPLAN_Dashboard.jpg

Once you have chosen your Region and named your new Project, you will be directed to the Impacts screen. From here, click on Add New Event to create a Institutional Spending Pattern Event. In this set of examples, 2018 Nevada data is utilized.

Institutional_Spending_Pattern_-_Impacts.jpg

Institutional Spending Pattern Events are unique in that they describe both Intermediate Inputs and Value Added within the same Spending Pattern. This results in these Spending Patterns producing ‘mixed results;’ where the reported Direct Effects describe both what we would generally consider Direct Effects (income, Employment and Value Added) and the first-round Indirect Effects that arise from the government spending its budget. Institutional Spending Pattern Events can be edited. Learn more in the article Editing Institutional Spending Pattern Events.

In this example, we want to look at a potential $1M increase in education spending by the government. We will give our new Event a Title, select the Type as Institutional Spending Pattern, the Specification is 12002 – State/Local Government Education, and the Value is $1,000,000. 

Institutional_Spending_Pattern_-_Event.jpg

Now that you have your Event, ensure that it is highlighted in teal by clicking on the Event or checking Select All Events at the top of the screen. Now the Events can be dragged into your Group on the right.

Institutional_Spending_Pattern_-_Drag.jpg

You will know when the Events have populated in the Group when the number in the upper right of the Group box equals the number of Events.

Institutional_Spending_Pattern_-_Group.jpg

Now click Run in the bottom right of the Impacts Screen.

The Institutional Spending Pattern Event Type represents a general spending distribution for measuring broad Institutional activity in your Region. 

Institutional_Spending_Pattern_-_Results.jpg

RELATED ARTICLES

ABP: Introduction to Analysis-By-Parts

Editing Institutional Spending Pattern Events

Explaining Event Types

Industry Contribution Events

INTRODUCTION

Industry Contribution Analysis (ICA) is a method used to estimate the value of an Industry or group of Industries in a Region, at their current levels of production. While the focus of the analysis still looks at backward linkages, the purpose of this analysis differs from the standard economic impact analysis. ICA shows the relative extent and magnitude of the Industry, event, or policy in the study area.

ICA is a unique method which applies a constraint upon the model by removing feedback linkages (buybacks) to the Industry being analyzed. This method can also be used with single firms, but if/when it is, the results of this method should be considered conservative.

ICA denotes that the study is looking at how the current state of an Industry supports other businesses in the local economy. When this involves a single firm, the analyst will need to determine if the Impact Method or Industry Contribution Analysis Method should be used. The results in either case should be described with words such as “contributes to” or “sustains.”  

Event Type

Industry Contribution

Event Use

Estimating effect of an existing Industry’s production

Event Specification

”WHO” 

Industry 1-546  for which the contribution is being measured

Event Value

“WHAT”

Output or % of Industry


INDUSTRY CONTRIBUTION EVENTS

IMPLAN can be accessed via app.IMPLAN.com. Once you are logged in, you will be directed to the IMPLAN dashboard. From the dashboard you can navigate to the Regions, Impacts, or Projects screen. 


IMPLAN_Dashboard.jpg


Once you have chosen your Region and named your new Project, you will be directed to the Impacts screen. From here, click on Add New Event to create a Industry Contribution Event. In this set of examples, 2018 Nevada data is utilized.


ICA_-_Impacts.jpg

In this example, we want to look at the contribution of the entirety of the hotel Industry in Nevada. We will give our new Event a Title, select the Type as Industry Contribution Analysis, the Specification is 507 – Hotels and motels, including casino hotels, and the Value is 1. The buttons after the Event Value give us the choice between entering a dollar value or entering a percentage of the total Industry. In that we want to see the entire Industry, we will select the %. Check out the article Picking an Industry for assistance in choosing the appropriate IMPLAN Industry.


ICA_-_Event.jpg

Now that you have your Event, ensure that it is highlighted in teal by clicking on the Event or checking Select All Events at the top of the screen. Now the Events can be dragged into your Group on the right.


ICA_-_Drag.jpg

You will know when the Events have populated in the Group when the number in the upper right of the Group box equals the number of Events. You will also see a new icon in teal indicating that this is an Industry Contribution Analysis.

ICA_-_Group.jpg


Now click Run in the bottom right of the Impacts Screen.


ICA_-_Results.jpg

To see how the constraints on the hotel Industry worked, navigate to the Output tab in the Results. The largest Industry in terms of Output was Industry 507 – Hotels and motels, including casino hotels with a total of $15,193,837,564.97. On the Industries by Impact table, you can see that the entirety of this was in the Direct Effect and the Indirect and Induced Effects in this Industry are zero. If we had used a standard Industry Output Event, there would be additional Indirect and Induced Effects in our Results.


ICA_-_Output_Results.jpg


RELATED ARTICLES

Explaining Event Types

ICA: Introduction to Industry Contribution Analysis

Industry Spending Pattern Events

INTRODUCTION

Industry Spending Patterns include all Intermediate Inputs for a given Industry. Industry Spending Pattern Events are most appropriate to use when an analyst has the data required to build a customized Spending Pattern which reflects specific purchases by an Industry or when the ratios in an Industry’s Leontief Production Function must be modified to a degree beyond that which is achievable by simply customizing an Industry Event. 

Event Type

Industry Spending Patterns 

Event Use

Analyzing a change in Intermediate Inputs

Event Specification

”WHO” 

Industry 1-546 making purchases of Intermediate Inputs

Event Value

“WHAT”

Intermediate Inputs or Output (per Advanced Menu)

INDUSTRY SPENDING PATTERN EVENTS

IMPLAN can be accessed via app.IMPLAN.com. Once you are logged in, you will be directed to the IMPLAN dashboard. From the dashboard you can navigate to the Regions, Impacts, or Projects screen. 

IMPLAN_Dashboard.jpg

Once you have chosen your Region and named your new Project, you will be directed to the Impacts screen. From here, click on Add New Event to create an Industry Spending Pattern Event. In this set of examples, 2018 Nevada data is utilized.

Industry_Spending_Pattern_-_Impacts.jpg

At the most basic level, Industry Spending Pattern Events can be used to examine the economic impact of only the Intermediate Inputs of an Industry. Intermediate Inputs are the purchases of non-durable goods and services that are used to produce other goods and services rather than for final consumption. Industry Spending Patterns can be edited through the Advanced Menu. Learn more in the article: Editing Industry Spending Pattern Events.

In this example, we want to look at only the spending on Intermediate Inputs by casinos. We will give our new Event a Title, select the Type as Industry Spending Pattern, the Specification is 503 – Gambling industries (except casino hotels), and the Value is $1,000,000. Check out the article Picking an Industry for assistance in choosing the appropriate IMPLAN Industry.

Industry_Spending_Pattern_-_Events.jpg

Now that you have your Event, ensure that it is highlighted in teal by clicking on the Event or checking Select All Events at the top of the screen. Now the Event can be dragged into your Group on the right.

Industry_Spending_Pattern_-_Drag_Events.jpg

You will know when the Events have populated in the Group when the number in the upper right of the Group box equals the number of Events.

Industry_Spending_Pattern_-_Group.jpg

Now click Run in the bottom right of the Impacts Screen.

The first thing you will notice is that there are no Direct Effects. Industry Spending Pattern Events only affect spending on Intermediate Inputs, so there will only be Indirect and Induced Effects. Learn more in the article Explaining Event Types.


Industry_Spending_Pattern_-_Results.jpg

Industry Spending Pattern Events are often used as part of Analysis-by-Parts (ABP). ABP allows you to examine a specialized Industry or a firm that is not reflected by an IMPLAN Industry due to differences in the structure of the Leontief Production Function and/or Spending Pattern that cannot be edited via a single Industry Event. This type of analysis is typically used to split the stemming ripple effects of an Industry Impact into its individual impact components – budgetary Spending Pattern (Intermediate Inputs), which can be analyzed using an Industry Spending Pattern Event, and payroll, which can be analyzed using Labor Income Event(s).


RELATED ARTICLES

ABP: Introduction to Analysis-By-Parts

Editing Industry Spending Pattern Events

Explaining Event Types

Understanding Intermediate Inputs (II)

Household Income Events

INTRODUCTION

Household Income Events are appropriate to model a change in Household Income isolated from Industry production and payroll. In Household Income Events, you can specify the specific income group(s) receiving the income. Examples would be a government stimulus check or tax refund.

Household Income values should include all new Household Income the residents will receive including personal tax and savings. IMPLAN will automatically deduct personal tax and savings. Household spending of income on imported goods and services will also be treated as leakage.

Event Type

Household Income Events

Event Use

Analyzing a change in Household Income separately from production 

Event Specification

”WHO” 

HH LT15K, HH 15-30K, HH 30-40K, HH 40-50K, HH 50-70K, HH 70-100K, HH 100-150K, HH 150-200K ,HH GT200K

Event Value

“WHAT” 

Total Household Income for specified income group


HOUSEHOLD INCOME EVENTS

IMPLAN can be accessed via app.IMPLAN.com. Once you are logged in, you will be directed to the IMPLAN dashboard. From the dashboard you can navigate to the Regions, Impacts, or Projects screen. 

IMPLAN_Dashboard.jpg

Once you have chosen your Region and named your new Project, you will be directed to the Impacts screen. From here, click on Add New Event to create a Household Income Event. In this set of examples, 2018 Nevada data is utilized.

Household_Income_Event_-_Add_Event.jpg

Household Income represents the income received by people for their participation in production, from government and business transfer payments, and from returns on capital (e.g., interest payments, dividends). Household Income Events allow the analyst to pick which income group(s) will receive the gain or loss of income.

Specification

Explanation

Households LT15k

Those earning less than $15,000

Households 15-30K

Those earning between $15,000 and $30,000

Households 30-40K

Those earning between $30,000 and $40,000

Households 40-50K

Those earning between $40,000 and $50,000

Households 50-70K

Those earning between $50,000 and $70,000

Households 70-100K

Those earning between $70,000 and $100,000

Households 100-150K

Those earning between $100,000 and $150,000

Households 150-200K

Those earning between $150,000 and $200,000

Households GT200K

Those earning greater than $200,000

In this example, there will be a stimulus check for households that earn less than $40,000. We are told this will result in $2,000,000 of new income in Nevada for households earning less than $15K, $1,500,000 for households earning between $15-30K, and $3,000,000 for households earning between $30-40K. Therefore, we will set up one Household Income Event for each household level.

Household_Income_Event_-_3_Events.jpg

Now that you have your Events, ensure that all are highlighted in teal by clicking on them individually or checking Select All Events at the top of the screen. Now the Events can be dragged into your Group on the right.


Household_Income_Event_-_Drag.jpg

You will know when the Events have populated in the Group when the number in the upper right of the Group box equals the number of Events.

Household_Income_Event_-_Group.jpg

Now click Run in the bottom right of the Impacts Screen.

The first thing you will notice is that there are no Direct or Indirect Effects. Household Income Events only affect household spending, so there will only be Induced Effects. Learn more in the article Explaining Event Types.

In this example, we included three Events, so the default on the Results screen will include all three. If you want to look at the impacts for just one Event, click on Filters and search for the Event Name that you want to see.


Household_Income_Event_-_Results.jpg

RELATED ARTICLES

Explaining Event Types